Dashboard
On the Dashboard
Last Updated At and Refreshing
You can view the last time the Dashboard was loaded in the top left underneath the Date filter, and if you've had it open for a while the data on this report could be outdated. Click on the Refresh icon to reload the Dashboard.
Dashboard At a Glance Report
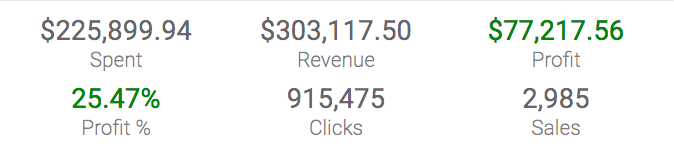
The At A Glance Report shows the stats of the number of Campaigns, the total amount they have Spent, the total Revenue of those campaigns, the total Profit of the campaigns, the Profit Percentage (Profit / Revenue), the total number of Clicks the campaigns have, and the total number of Sales.
Top 10 Campaigns Report
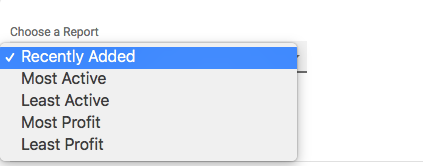
Use the dropdown to display the campaigns based on the report selected:
- Recently Added lists the last 10 campaigns created.
- Most Active lists the campaigns with the most clicks.
- Least Active lists the 10 campaigns with the least amount of clicks with a minimum of 1 click.
- Most Profit lists the 10 campaigns with the highest profit.
- Least Profit lists the 10 campaigns with the lowest profit.
Common Uses:
This report is a useful resource to see how campaigns are doing: which are the most active, making the least profit, and other options.
Remember that these stats are dependent on the filters, which allow for more precise looks into how campaigns are performing.
Profit Breakdown Chart
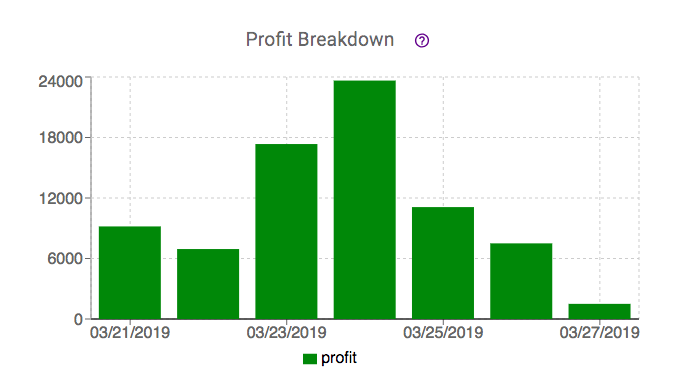
The Profit Breakdown Chart displays the profit for individual days based on the Date filter and Days filter you have selected.
Green columns indicate days where there was profit, and Red columns indicate where there was loss.
You can hover over a day to show the profit for that day:
Common Uses:
You can use the profit breakdown chart for a quick glance into what days your campaigns did well on, and what days are not near your target profit.
Campaign Performance Chart
The Campaign Performance Chart works similarly to the Profit Breakdown Chart. Performance is broken down by the filters, and dates shown will have columns for both clicks and conversions.
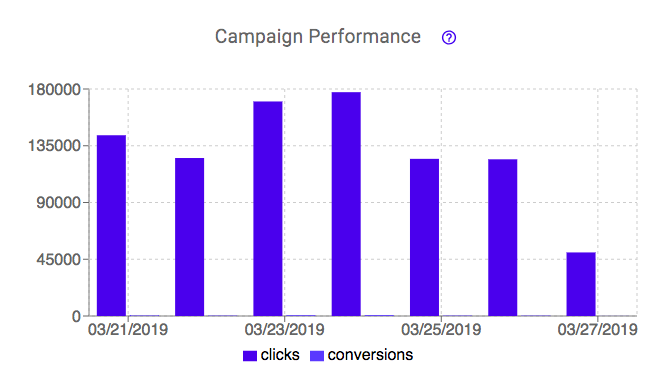
You can hover over a day to see the clicks, conversions, and CVR (conversion rate) for those days:
Common Uses:
Compare the clicks and conversions side by side to view your overall campaign performance over time. Hovering over the individual days displays the CVR for that day. Couple this with day parting and you can pause or lower CPC for campaigns on days you think are underperforming.
Image Performance
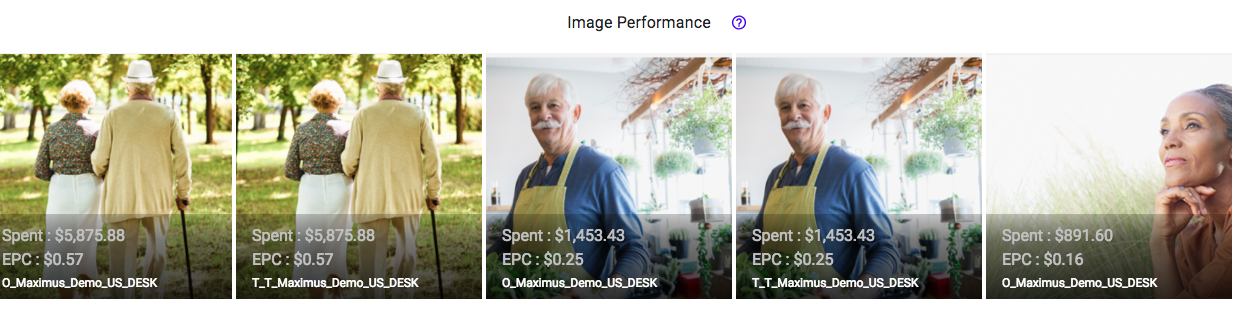
The Image Performance section shows the top spending images across the filtered campaigns for the date range you've selected. You can click on an image to view the campaign details page for that campaign.
This chart displays the amount spent for that campaign, the EPC (Earnings Per Click), and the Campaign Name it belongs to.
Common Uses:
This chart shows the images ordered from left to right based on the most spend. Use it as a jumping off point to look at how much your images have been spending, and what the EPC looks like on these images. If over the time frame you're looking at an image has high spend but a low EPC, it probably needs some attention! As you look through these images, if you're comparing similar campaigns you can get a great overview of how each campaign's images are performing compared to one another.
If you see an image that needs to be reviewed, be sure to check out the Top Performing Images for the campaign and see if this has been a good image over the life of the campaign, but has only recently lost some performance.
Maybe an image has a lot of spend, and has a healthy EPC - you can still improve performance by taking look at the routing for this image. Check out the Image/Site/Landing Report and start adding some static routes that seem to be working for the image - target those audiences viewing the image on sites you're running on, and send them to the landing page that is generating the most conversions!
Weekly Comparison Chart
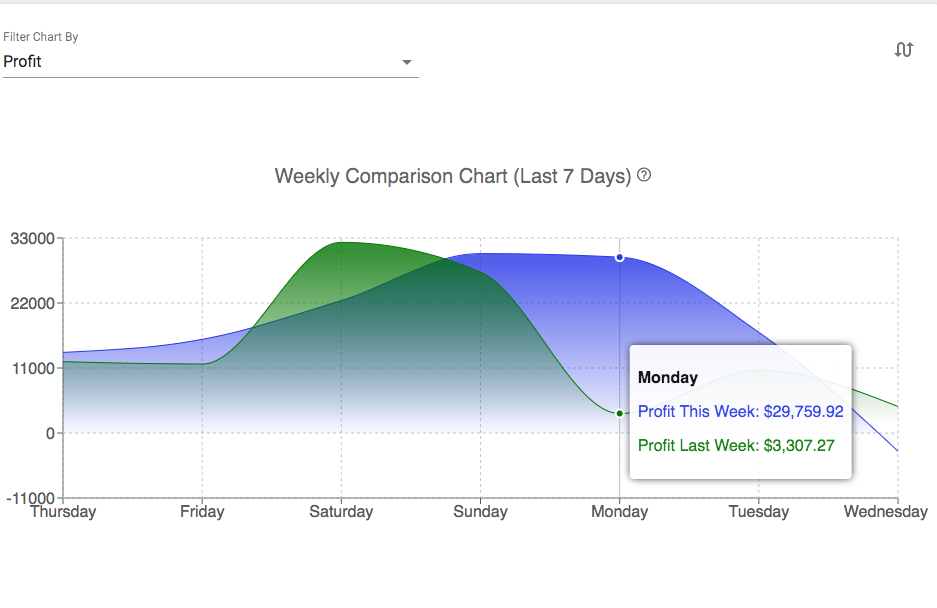
The Weekly Comparison Chart shows the comparison of data of the past 7 days (starting with the current day) to the 7 days prior. This data includes a comparison of total clicks, profit or sales.
Hovering over the chart shows the comparison of the data between the current week and the week prior.
Common Uses:
Compare profit from this past week versus the previous to see what performance looks like over the filtered campaigns. By monitoring trends you can evaluate what changes have been made or what needs to be worked on to continue optimizing your campaigns.