Dashboard
The Dashboard is the main page you land on when logging in to Maximus. This page makes necessary information from each of the 5 networks easily accessible. You can set several dashboard filters to customize which information is displayed, like the profit active account campaigns made during a specific month, or you can view the least active campaigns across all networks for the current week.
Filters
Campaign stats can be filtered by date, network, user, tracking type, and campaign status.
Filter Types
Filter data based on a date, including quick options like Yesterday, 2 Days Ago, and This Month.
This dropdown menu provides three options. Click here to learn more about the Days filter.
All Days: Show data for all days in the filter.
Week Days: Show data for days Monday—Friday in the filter.
Weekend: Show data for days Saturday and Sunday in the filter.
Filter the data based on a specific network. These networks include:
Taboola
Outbrain
RevContent
Content.Ad
Gemini
Filter the campaigns based on a Maximus user. Useful for viewing different sub users under an account.
Filter data based on tracking type. This includes:
CPA (cost per action)
CPC (CPC Feeds)
Filter data based on its status.
All Campaigns: View Active, Inactive, and Archived campaigns.
Active Campaigns: View active campaigns only.
Active and Inactive Campaigns: View both active and inactive campaigns.
Archived Campaigns: View archived campaigns. Users can archive campaigns by clicking the “Archive Campaign” toggle in the Campaign Details page.
Last Updated At and Refreshing
You can view the last time the Dashboard was loaded in the top left underneath the Date filter, and if you've had it open for a while the data on this report could be outdated. Click on the Refresh icon to reload the Dashboard.
Reports and Charts
To read more about the Reports and Charts for the Dashboard, click here.
At-A-Glance Report
At-a-glance stats display a quick view of campaigns, spent, revenue, profit, profit margin, clicks, and sales.
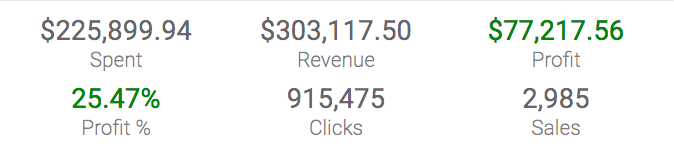
The total amount spent from campaigns with the applied filters.
The total revenue from campaigns with the applied filters.
The total profit from campaigns with the applied filters.
The profit margin from campaigns with the applied filters.
The total clicks from campaigns with the applied filters.
The total number of conversions from campaigns with the applied filters.
You can also view campaign data for highest-performing campaigns by clicking the report from the dropdown.
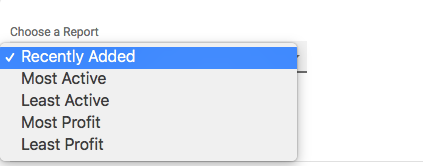
Shows the most recent 10 campaigns created. This will also display their status and if the campaigns are still pending, have been approved, or have been rejected.
Shows the 10 campaigns that have the most clicks.
Shows the 10 campaigns with the fewest number of clicks, with a minimum of 1 click.
Lists the 10 campaigns with the highest profit.
Lists the 10 campaigns with the lowest profit. This includes campaigns that are losing money, if any.
Charts
Graphs and charts display information for available campaigns based on applied filters. View graphs and charts that show profit breakdown, campaign performance, and image performance.
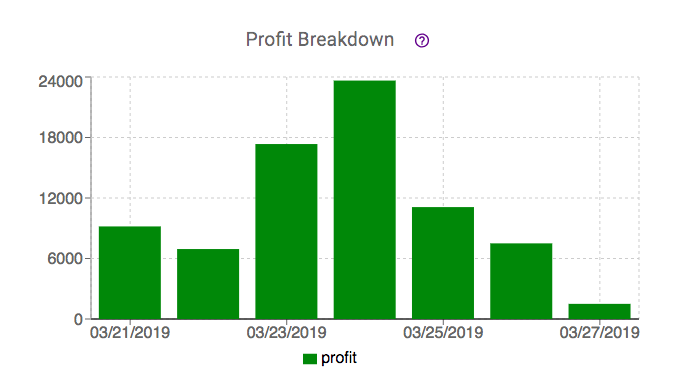
You can also hover over the graphs and charts to see the stats for those displayed days.
Displays total profit for the specified date or time period. Click here to read more about the Profit Breakdown chart.
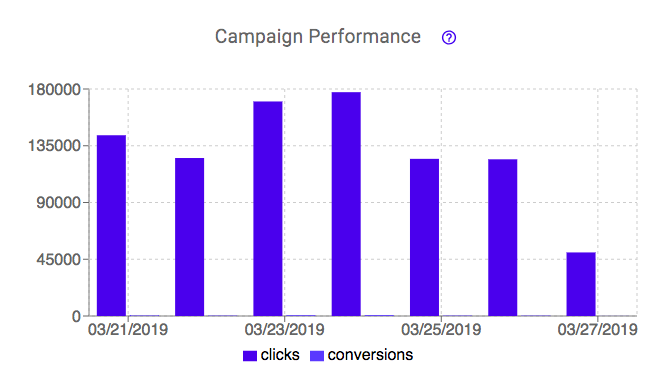
Displays the total clicks and conversions of the specified date or time period. Displayed as a double bar graph, allowing you to see the number of clicks compared to the number of conversions. Click here to read more about the Campaign Performance chart.
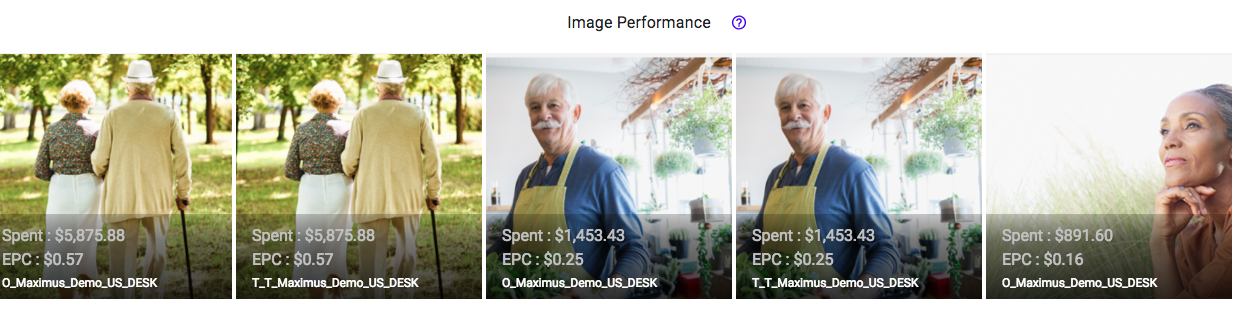
Show the top spending images across the filtered campaigns. Click on an image to view the campaign details page for that campaign. Click here to read more about Image Performance.
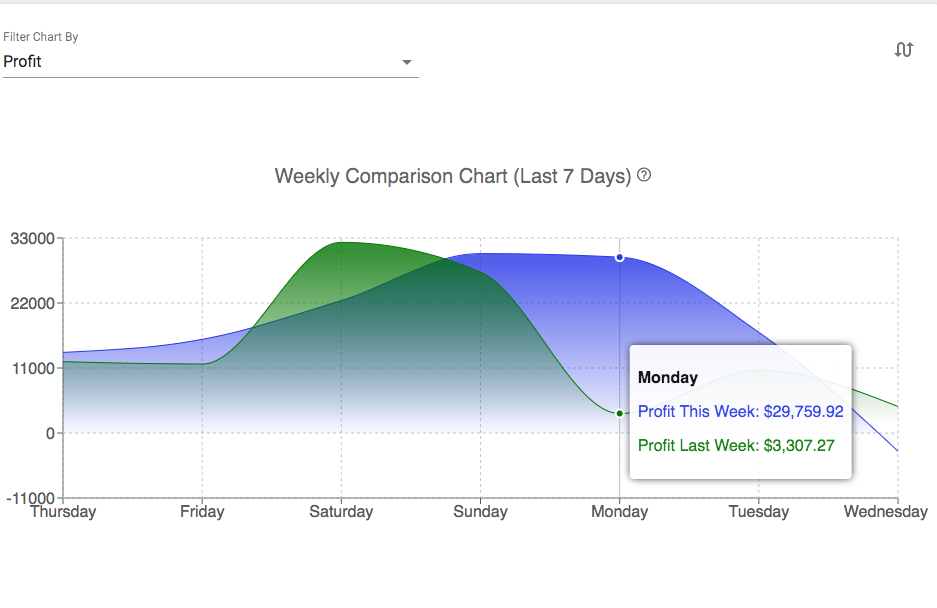
Displays the comparison of the Last 7 days with the previous 7 days before for profit, clicks and sales. Click here to read more about the Weekly Comparison chart.