Campaign Details Reports
- Overview
- Last Updated At and Refreshing
- Reporting
- Campaign Details At a Glance Report
- Sites Report
- Gemini Sites Report
- Images Report
- All Images Report
- RevContent Widget Report
- Conversions Report
- Clicks Report
- By Hour Report
- By Presell Report
- By Presell Sites Report
- By Landing Report
- Image/Site/Presell Report
- Image/Widget/Presell Report
- By Platform Report
- By State Report
- Gemini Bid Modifier Report
- Gemini By Age Report
- Gemini By Gender
- Gemini By Location
- Gemini Domains
- Campaign Log
Overview
Campaign Details Reports are available in an expandable menu by clicking the icon next to the report name. You can collapse or expand the reports menu by clicking this icon. When you select a report to view, Maximus will remember the last report you viewed and display it when you go to another campaign or refresh the current page.
Last Updated At and Refreshing
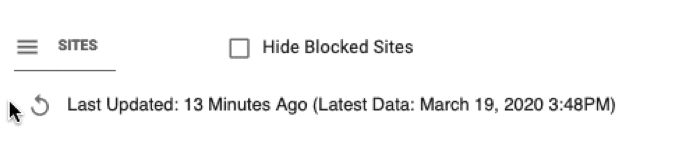
The majority of reports on the Campaign Details page feature at the top of the report show a Last Updated time, the Latest Data that is available to use on the report, and to the left of these an icon:
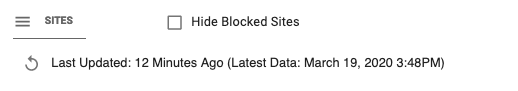
You can see how long ago you loaded the report with the Last Updated time. Clicking on the icon to the left of this will refresh the report to use the Latest Data available to use with that report.
Reporting
If you enable Advanced Tracking, the Clicks Report is replaced with the Visits Report and a new Clicks Report is available. Reporting that shows clicks is also updated to display Visits, Clicks, and Landing Page CTR %. Click here to learn more about Advanced Tracking.
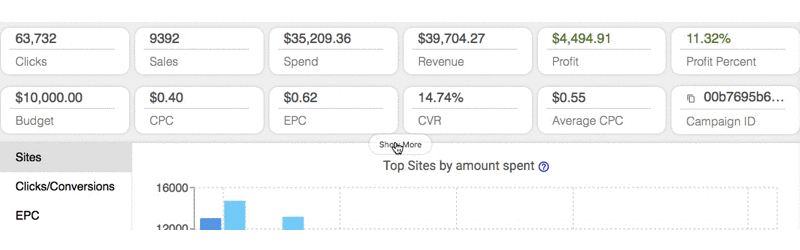
Campaign Details At a Glance Report
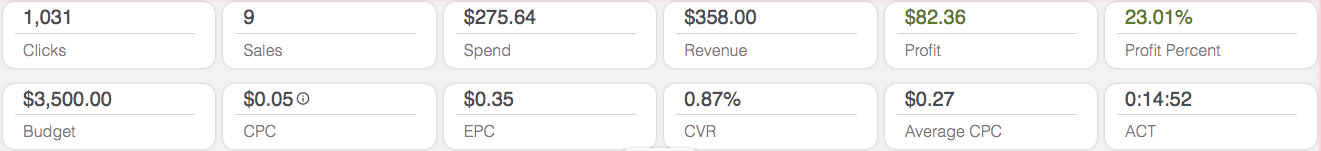
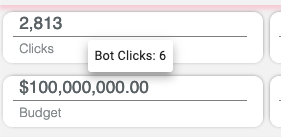
This Campaign Details At a Glance Report is similar to the Dashboard and Manage Campaigns. It also includes the current campaign CPC, the current campaign Budget, the CVR, the Campaign ID, the campaign Creation Date, and the Sub Account it is under.
You can edit the CPC and Budget from this area on the campaign by clicking on the value, entering a new one, and submitting the value.
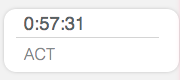
The Average Conversion Time, or ACT, is also located on this row. It shows the average amount of time between a click and a conversion for that campaign.
You can hover over your click total to view the number of bot clicks that has happened on that campaign in the time period you're currently viewing.
Clicking "Show More" displays the additional information for the campaign including the campaign Creation Date, and the Sub Account it is under and the Last Finalized Date if the campaign is a CPC campaign.
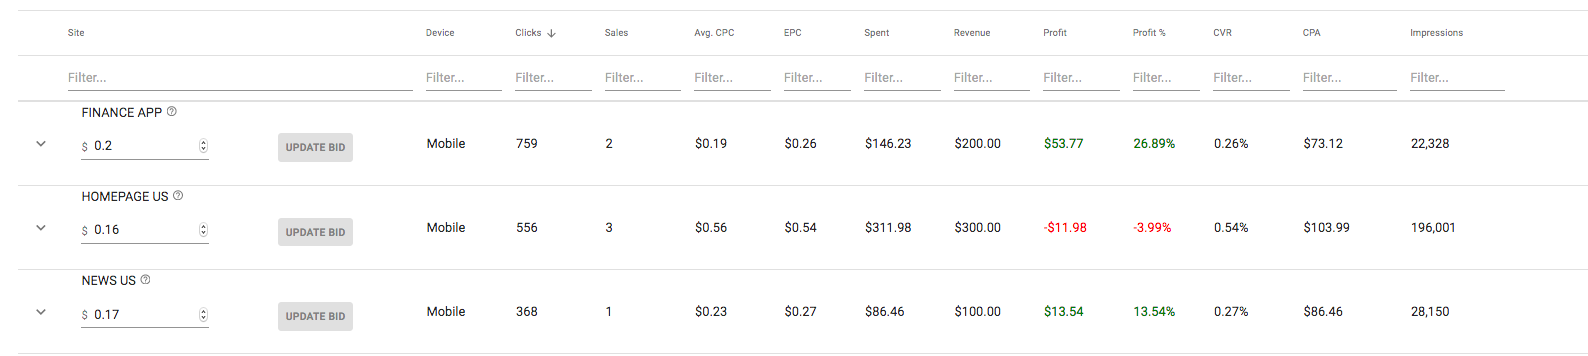
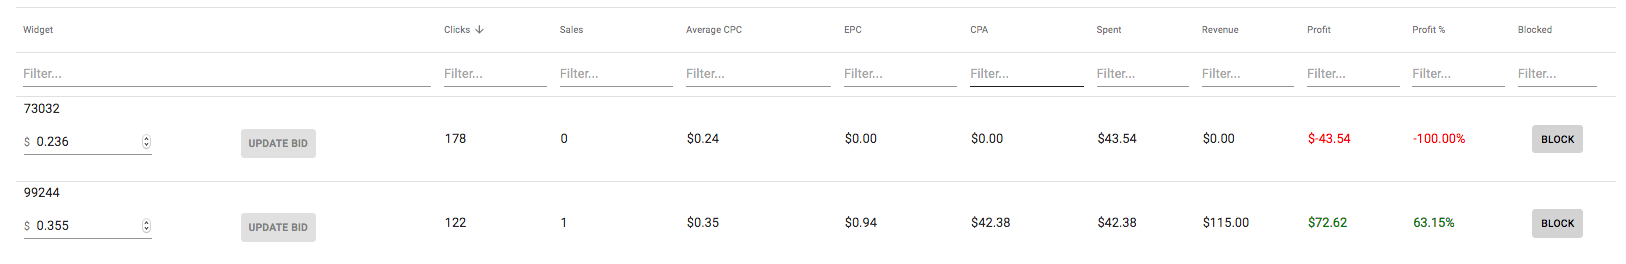
Sites Report
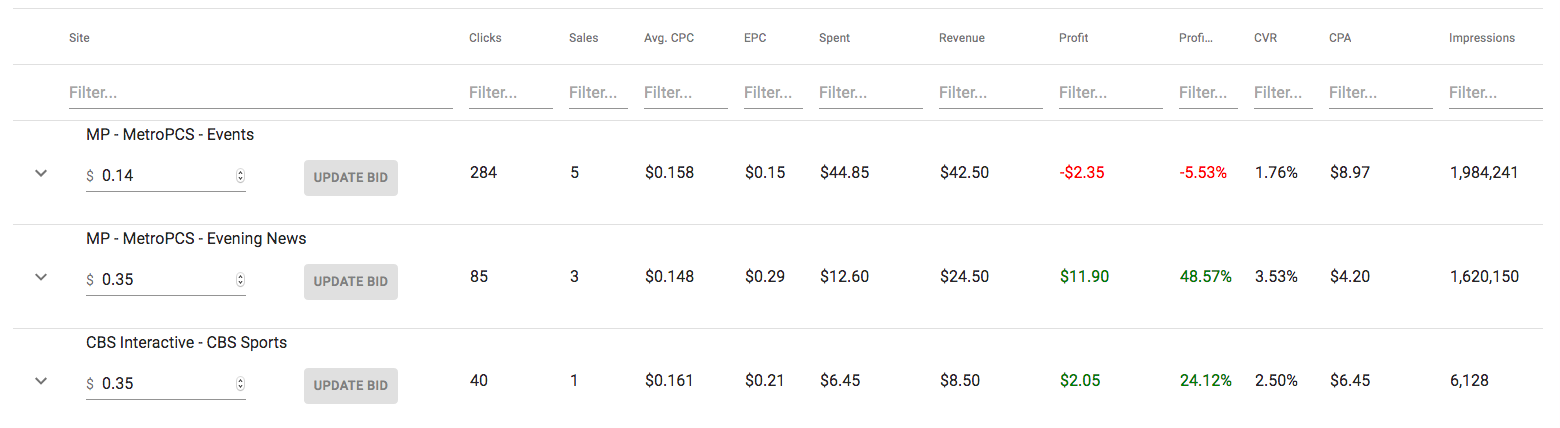
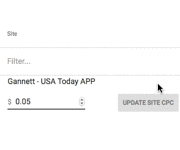
The Sites Report shows all sites which have received clicks in the time frame filtered. From the Sites Report you can bid on sites by typing in a value and clicking the Update Bid button.
Click on the arrow to the left of a site to view the expandable menu for that site.
Remove Site Bid will set the site bid back to the campaign CPC. This is useful for both managing the CPC and also managing total site bids for Taboola and Outbrain as they have a limit to the number of total site bids per campaign.
The Hourly Clicks will function exactly like the By Hour Report described below. You can also download a CSV of the stats for this report. The report will download with all columns, not just the ones you have visible.
Block allows you to block sites in Outbrain. Click here to read more about Site Blocking.
To learn more about Site Bidding click here to read our documentation about the subject.
Some networks have limitations on the number of sites you can bid on. The Sites report is different for Gemini, please review the section below for the Gemini Sites Report.
You can hide the blocked sites for the campaign by clicking on the checkbox at the top of the report. Click on this checkbox again to display all sites including blocked sites.
Common Uses:
This report gives a detailed look into how the campaign is performing on specific sites. Comparing Clicks, Avg CPC, EPC, Spend, Revenue, Profit, Profit %, Sales, CVR, Impressions, CTR, CPA, and also comparing to the Campaign CPC if you have updated the site CPC will give insight into what sites need to be blocked, have a static site CPC established, and more. You can use this information to test out similar campaigns across specific sites to see what type of ads work best on what sites.
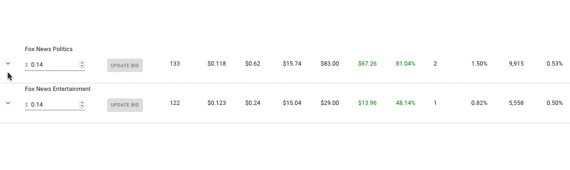
Gemini Sites Report
Gemini has Gemini Sites which operate differently from Sites Reporting. Click here to learn more about Gemini Site Bidding. Gemini Site Bids are done in multipliers of the campaign CPC.
You can expand to view more options like the Sites Report above.
The Gemini Sites Report shows the Site, Device, Clicks, AVG CPC, EPC, Spent, Revenue, Profit, Profit %, Sales, CVR, CPA, Impressions, CTR, and Network CTR. This report also contains a row entitled NA. This row displays the data that could not be attributed to a site. Maximus reconciles with Gemini throughout the day for the previous day to allocate this data to the correct sites.
Common Uses:
Add or update previously added site bids to further control how your campaign is spending. Reduce bids on lower performers and increase bids on those sites that are getting good EPC and have been maintaining good conversions.
Images Report
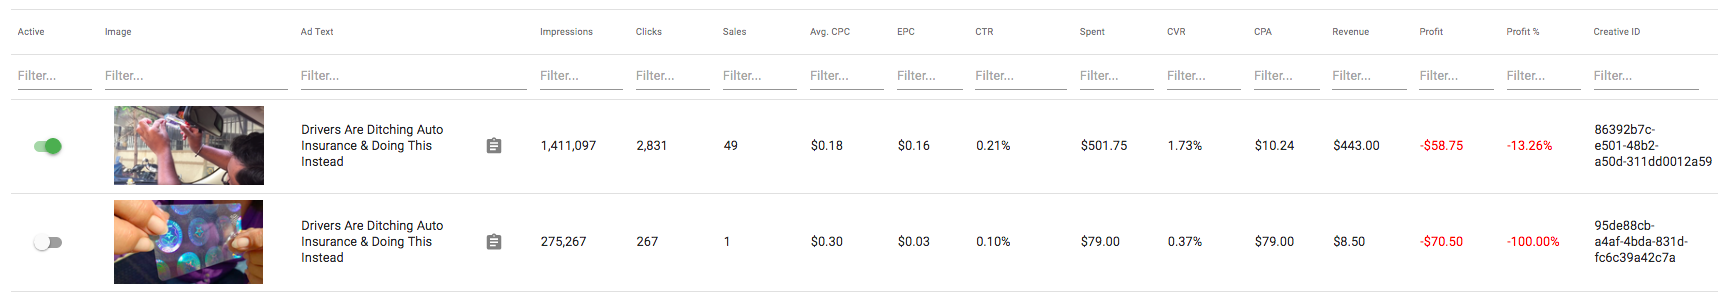
The Images Report shows the Active Status, a thumbnail of the Image, the Ad Text for this image, Impressions, Clicks, Avg CPC, EPC, CTR, Spend, Sales, CVR, CPA, Revenue, Profit, Proift %, and the Creative ID generated when you added the image. You can also click next to the Ad Text on the clipboard icon to see the keywords and emotional breakdown of words you have used.
Next to the Images Report you will see the number of active images. This number indicates how many ads have a status of 'Active' on the network and can receive traffic.
The Images Report itself displays any image that has received at least one click during the time frame you've selected. As an example, if an image received traffic yesterday but you paused it today, you can still see the image's data on the Images Report when filtered to 'Yesterday'. An image can have an 'Active' status but may not have received any clicks. The image will be included in the total next to the Images Report label, but you will not see this image in the report itself until it has received at least one click.
On the Images Report you can also edit the Ad Text by clicking on it and entering your changes. Click here for more information on how to edit ad text. Note that this will require Approval on the text and will also make tracking the text + image performance very difficult since you will have two different combinations after editing text. We recommend adding the same image again with new text.
Common Uses:
Compare image performance, turn off ads by pausing them, and prune off those which are not having success compared to your better performing images. Use images which are performing well for new campaigns, compare to ad text and try out different text if the image is not doing well, and more.
All Images Report
The All Images Report is similar to the Images report, but the only columns visible are Active Status, Image thumbnail, Ad Text, and Creative ID. This report can be used to view all images, if they have not received traffic in the filtered time period you can see them here. Use this report to turn images off or on if they do not have activity for the time period you are looking at.
RevContent Widget Report
This tab is only visible for RevContent campaigns in the Campaign Details page. The Widget Report shows the Widget, Clicks, Average CPC, EPC, CPA, Spent, Revenue, Profit, Profit %, Sales, and Blocked Status. You can block widgets in the same way you can block sites for RevContent.
Common Uses:
Widgets are placements on websites that are given a Widget ID number. You can use the Widget Report to see performance of widgets, and block those that appear to be underperforming, giving your campaign a better chance to grow while avoiding spending on the poor performers.
Conversions Report
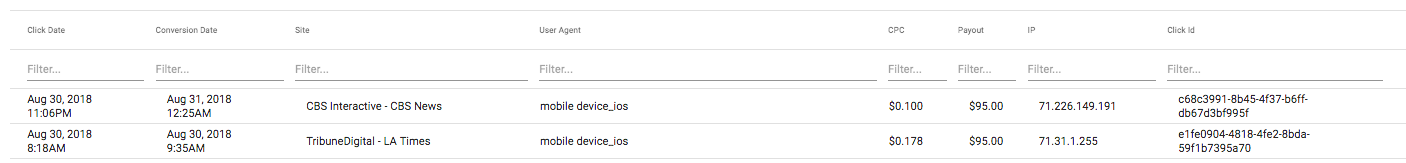
The Conversions Report will display the Click Date (when the user first clicked) and the Conversion Date (when the conversion happened) along with the Site the user converted on, the User Agent (device/platform), the CPC for that click, the Payout for the conversion, and the IP of the user who converted, and the Maximus generated Click ID.
Common Uses:
Search or group by Site to see what the stats on conversions were, evaluate the click to conversion length of time, and search or group to compare what CPCs were for these users who clicked. Search or group the user agent to find what platform/device is working well for the site.
Clicks Report
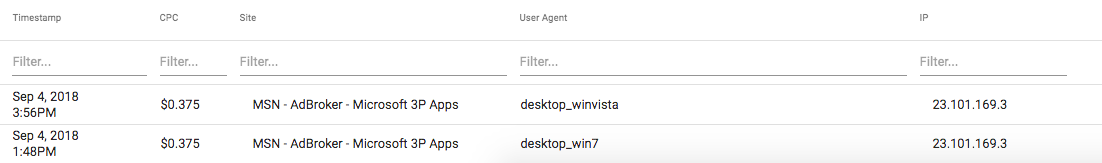
The Clicks Report displays the last 150 clicks for the campaign, including Timestamp (date and time of clicks), the CPC for those clicks, what Site the click was on, the User Agent (device/platform) the clicks happened on, and the IP of the clicker.
Common Uses:
Compare the recent clicks and see where bids are happening over the past 25 clicks. Drag to group the CPC, Site, and User Agent to view what the comparison on different CPCs, sites, and devices were for those clicks.
By Hour Report
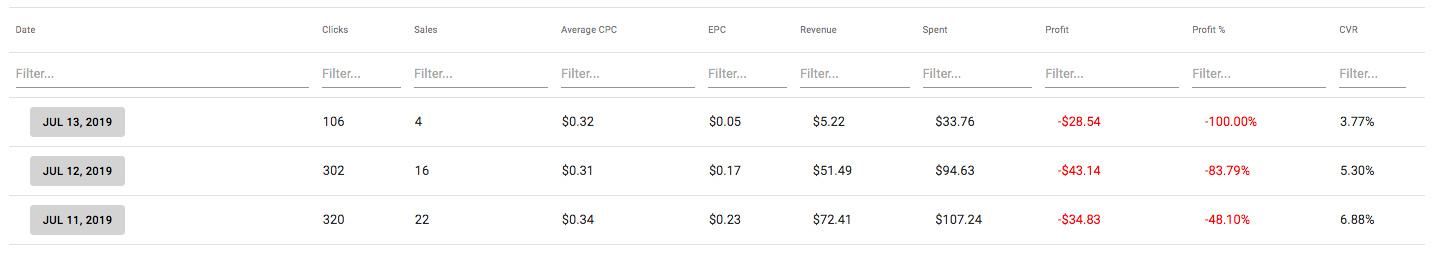
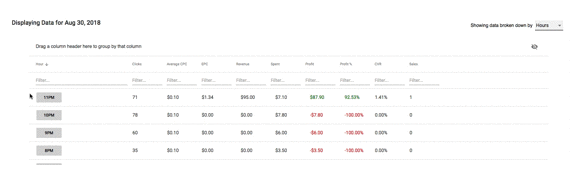
The By Hour Report displays the Clicks, Average CPC, EPC, Revenue, Spend, Profit, Profit %, CVR, and Sales (total conversions). When first using the report, the individual days show up as buttons.
Click on a date to view the By Hour breakdown for that day, which will create a new frame on the page with the data for the date you selected.
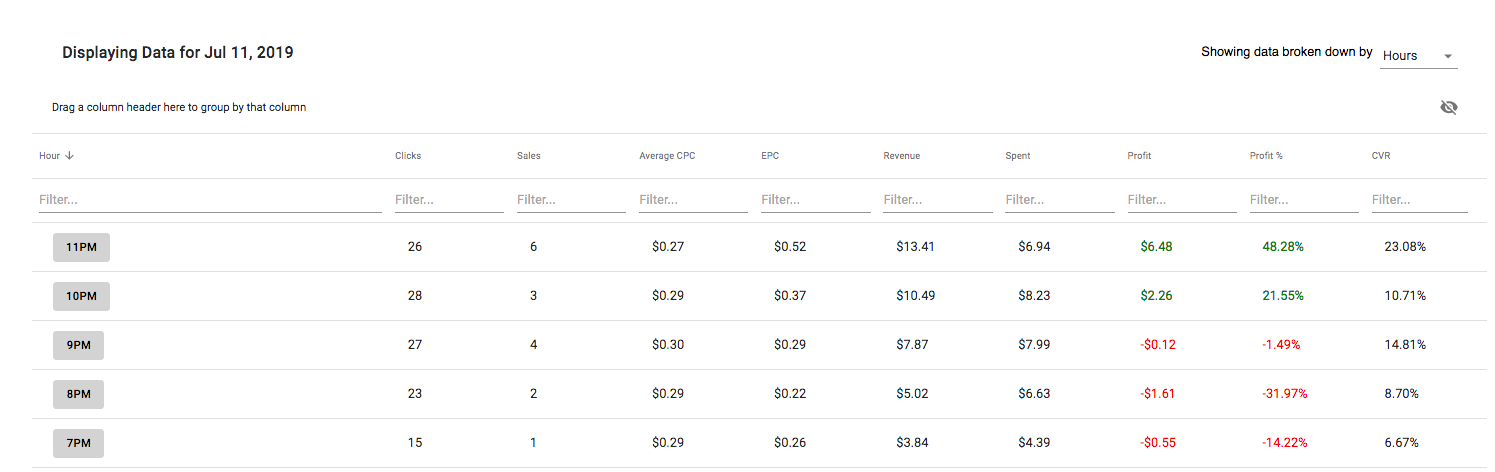
This reporting shows the same columns, and also allows you to go to a more precise look at the stats by either clicking the hour button or using the dropdown in the top right to change between Hours and Minutes. If you click on the hour and want to get back to the hourly view instead of minutes, use the dropdown and select Hours again.
Common Uses:
The breakdown on days, hours, and minutes gives a closer look on campaign performance. Use this information with Day Parting to optimize your campaign to not run at certain times. You can investigate an increase in conversions for a time frame and see what activity happened in that hour as well.
By Presell Report
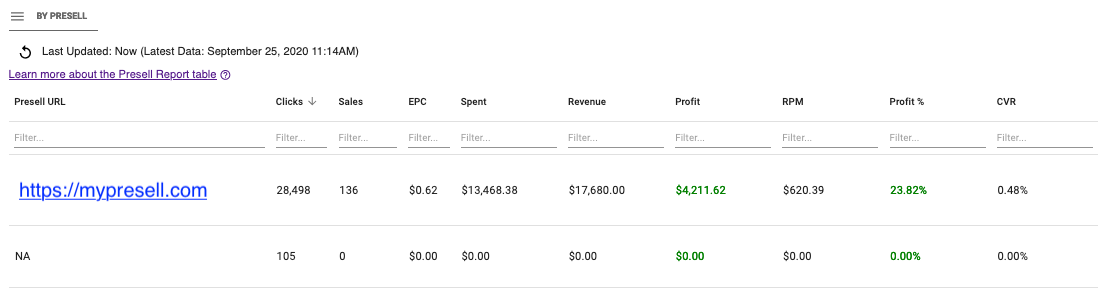
The By Presell Report shows all presell links that have received traffic in the filtered time frame. The Presells that have received traffic are shown with the Clicks received, EPC, Spend, Revenue, Profit, RPM (1000 x [Revenue / visits] ), Profit %, Sales, and CVR. If you have multiple presell links, these will display here. If Advanced Tracking is enabled, this report shows the Visits, Clicks, and Landing Page CTR % for the presells.
Common Uses:
Compare how different presells perform against each other and use this to adjust the weights of the links. If you see a great profit % on one presell but it has a lower weighted link %, consider changing it to a higher percentage and see how it will do in comparison to others. Use the Conversion Rate % (CVR) to see how well clicks are translating to conversions and decide which presells are performing best.
By Presell Sites Report
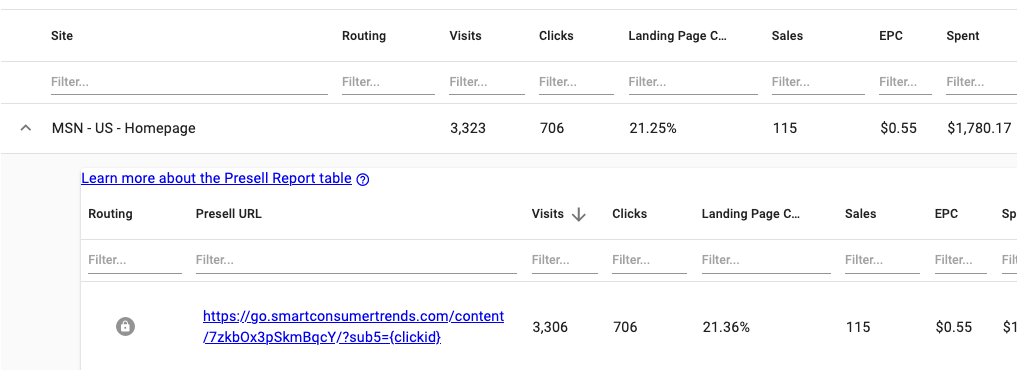
The By Presell Sites Report shows the sites which have received traffic, and the stats for the Presells users have went to when clicking an ad on that site. Expand by clicking on a site name to view all the presell data for that site. If Advanced Tracking is enabled, this report shows the Visits, Clicks, and Landing Page CTR %.
Gemini By Presell Sites Report
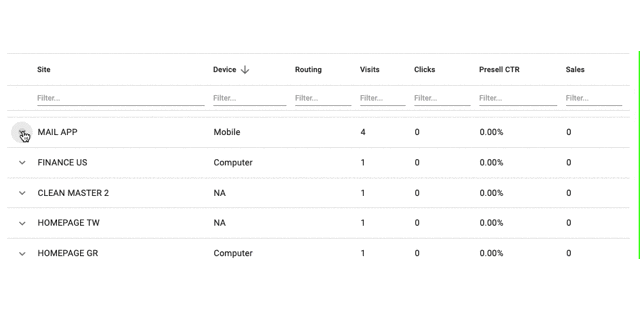
Gemini campaigns bid on the site x device level, meaning that a site has 2 separate placements - one for desktop, and one for mobile. In the By Presell Sites Report you will be able to route these as separate placements, and you can identify them by using both the Site column and the Device column.
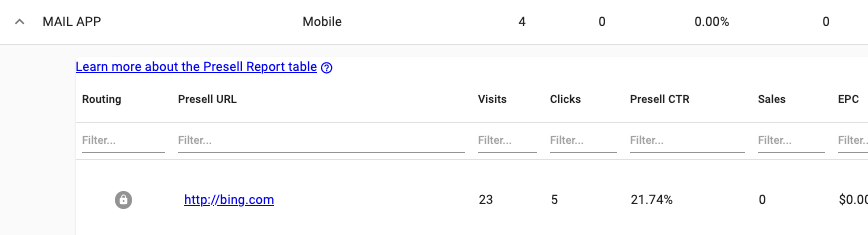
In the this example, MAIL APP Mobile is open and displaying presell data. MAIL APP Desktop would be a separate row in this report with its own presell data.
To route simply click on the lock icon of the presell(s) you want your traffic to go to, just like other site routing. This route in this example will only affect the MAIL APP Mobile placement.
Common Uses:
From the expanded view where you can see the Presell pages, you can route sites to make a site always go to one specific presell link. Click here to learn more about site routing. Compare what sites are having success with which presells and determine if you may need to make adjustments to weighted link percentages or set up routing to get the most out of your traffic.
By Landing Report
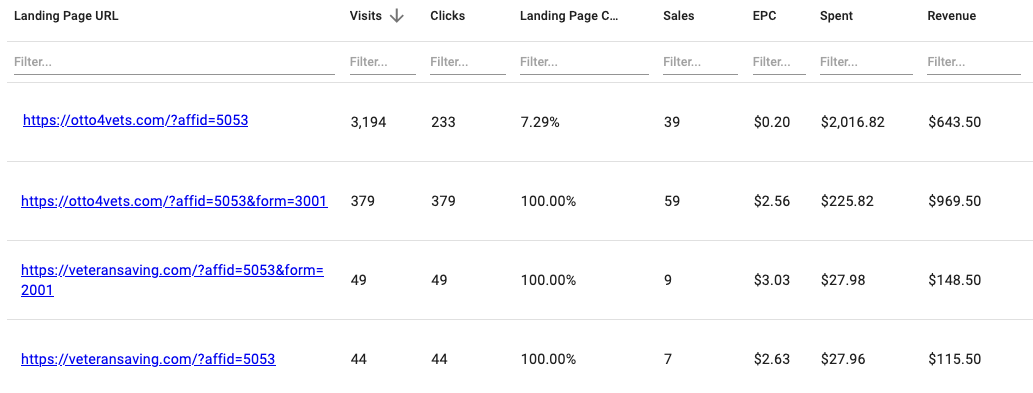
The By Landing Report is just like the By Presell report, and replaces that report when you enable Advanced Tracking on your campaign. You can find the Landing Page, Visits, Clicks, Landing Page CTR %, Sales, EPC, Spent, and Revenue on this report.
This report will also include a NA Row for traffic that did not click through to the landing page so you can compare the visits and spend of traffic which only got as far as the presell, in comparison to those who clicked through and got to your landing pages.
Common Uses:
The By Landing report is useful to compare the performance of landing pages against each other - if you're using more than one landing page link, you can view the traffic going to that landing page and other important stats as well. If it looks like you're getting better performance out of one landing page, you may want to alter the weights to send more traffic to that landing page using the Edit Links drawer. This report is helpful in testing out different offer pages to get the most out of your funnel.
Image/Site/Presell Report
The Image/Site/Presell Report allows you to view image performance similar to the Images Report, view how each image performs per site, see performance by presell of that image/site combination, and choose which presell you'd like that image/site combination to route to. Click here to learn more about the Image/Site/Presell report in greater detail. The Status column will show if an image is currently active (Green) or paused (Red). This status does not reflect the approval status of the images.
Common Uses:
Use this report to see how each image performs on each site. This information could be used to create new campaigns that whitelist the sites that perform best on each image. This report also allows you to go even deeper into the data and see how each presell is performing on the image/site combination and allow routing to the best performing presell.
Image/Widget/Presell Report
The Image/Widget/Presell Report allows you to view image performance similar to the Images Report, view how each image performs per widget, see performance by presell of that image/widget combination, and choose which presell you'd like that image/widget combination to route to. Click here to learn more about the Image/Widget/Presell report in greater detail. The Status column will show if an image is currently active (Green) or paused (Red). This status does not reflect the approval status of the images.
Common Uses:
Use this report to see how each image performs on each widget. This information could be used to create new campaigns that whitelist the widgets that perform best on each image. This report also allows you to go even deeper into the data and see how each presell is performing on the image/widget combination and allow routing to the best performing presell.
By Platform Report
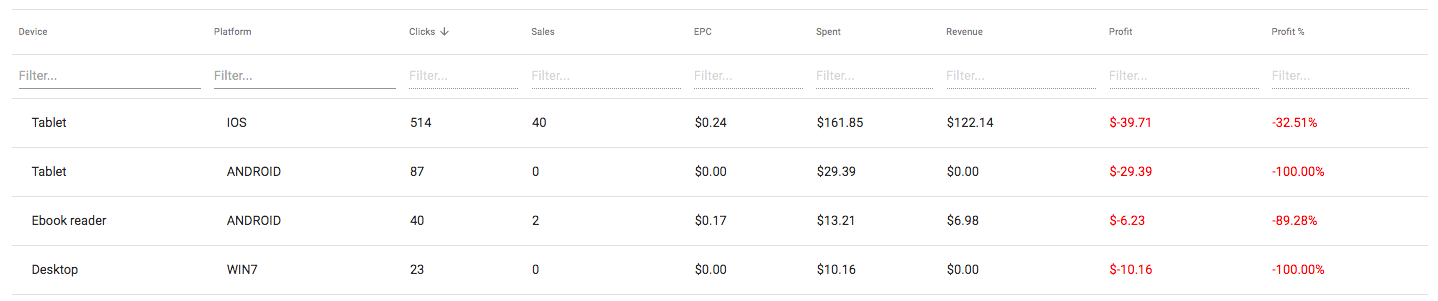
The By Platform Report displays the Device (Mobile, Desktop, or Tablet), Platform (Operating System), Clicks, EPC, Spend, Revenue, Profit, Profit %, and Sales for the device+platform combination.
Common Uses:
Search or drag to group to find out which devices and platforms are performing well. You can learn about your audience and the types of devices that converters are using and use that to create new campaigns targeting that device. If your network supports it, you can also target platforms (operating systems) on their network page for the campaign. Click here to learn more about network targeting.
By State Report
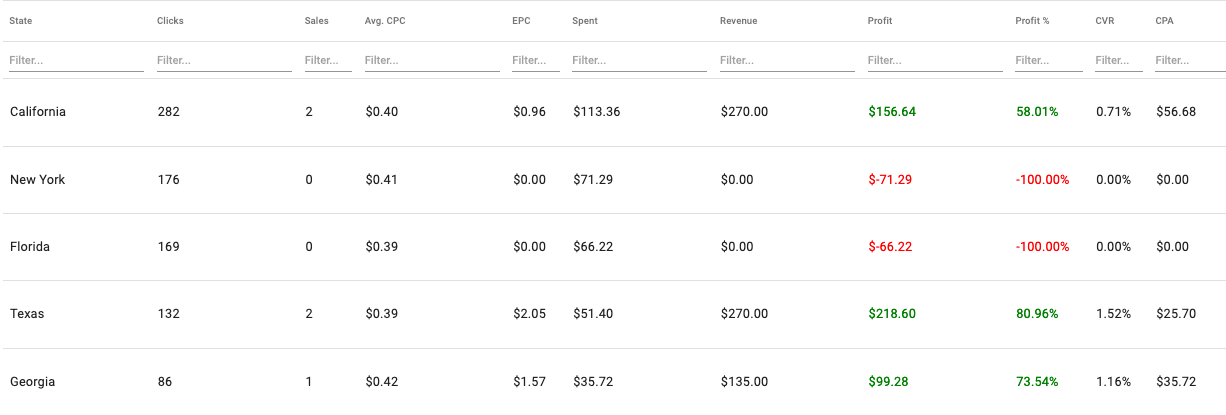
The By State Report displays the State, Clicks, Sales, Avg. CPC, EPC, Spent, Revenue, Profit, Profit %, CVR, and CPA. This report displays only for US targeted campaigns.
Blocking States With Taboola
In the By State Report, Taboola campaigns have the ability to block and unblock a state from Maximus. Click on the arrow next to the state name to expand to see the block option.
You can click to block a state using the button underneath it:
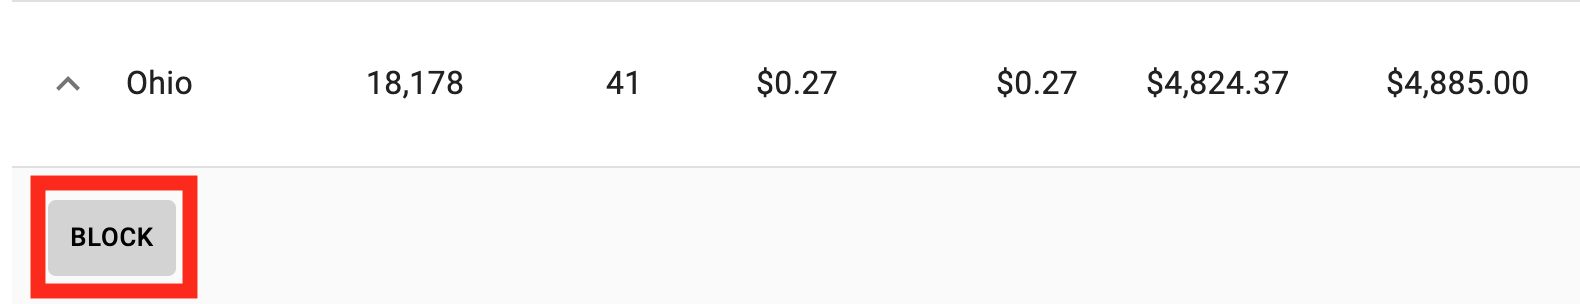
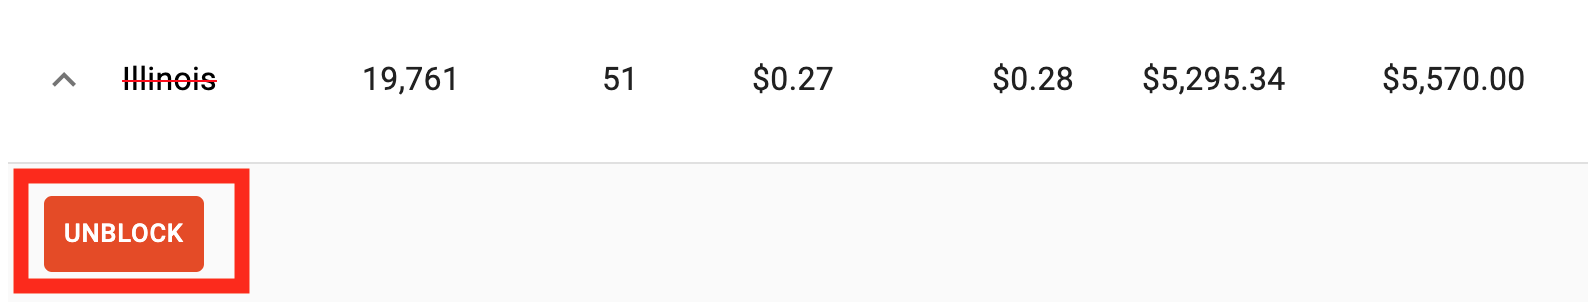
States which are blocked will have a red line through them. Click on Unblock to unblock the state.
Common Uses:
The By State Report is used to analyze the states your traffic is coming from. By breaking down data by state you can work on customizing campaigns by updating targeting on the network. To learn more about targeting on the network and what you can update outside of Maximus visit our doc by clicking here.
It may be beneficial to clone the campaign and create specific campaigns targeting states/regions from a fresh campaign to get better data and try out new strategies.
Blocking a state in Maximus for a Taboola campaign, or on the network for other campaigns, can let you reduce unwanted traffic while still targeting most of the whole country. Click here to read more about making targeting adjustments on the network.
Gemini Bid Modifier Report
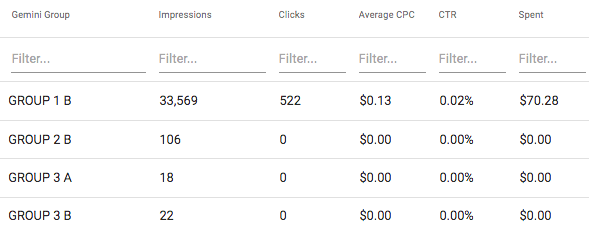
The Gemini Bid Modifier Report is only available for Gemini Campaigns. This report displays the Gemini Groups which have Impressions, and the Clicks, Average CPC, CTR, and Spend for those groups.
“A” groups target desktop, while “B” groups target tablet and mobile traffic. Because Gemini does not allow platform-specific targeting, a bid must be set for each group. However, decreasing the bid adjustment to the minimum lowers the likelihood of your ad appearing on other platforms. It is recommended that you begin to optimize these modifiers once you have a measure of campaign performance. Bid adjustments are percentage values that edit your spend for specific publisher groups. Use both positive and negative modifiers to make bid adjustments. For example, if you set a CPC of $1.00 and set Group 1-A’s bid adjustment to 100%, your Group 1-A bid will be $2.00. If you set Group 2-A to -50%, your Group 2-A bid will be $0.50.
To learn more about Gemini Groups read Verizon Media's official documentation by clicking here.
Common Uses:
The stats for Group performance will allow you to modify bid adjustments to balance out and optimize your campaign. Use the Gemini Settings to adjust group bid percentages to make the most out of your campaign's spending. Typically Groups 1A and 1B perform the best but you may see even greater CTR on other groups as well depending on the campaign.
Gemini By Age Report
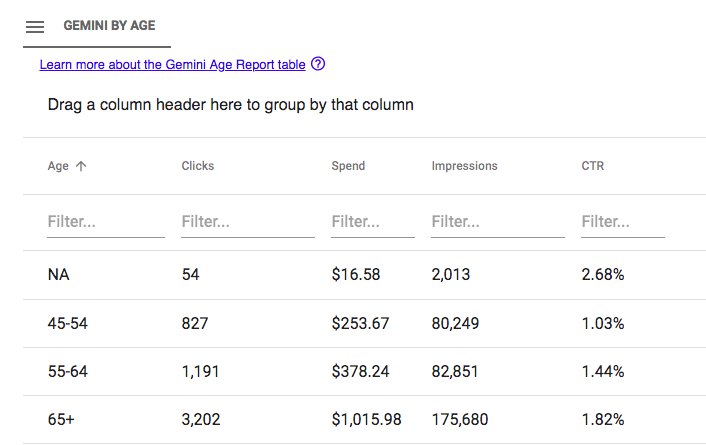
The Gemini Age Report is only available for Gemini Campaigns. This report displays the Clicks, Spend, Impressions, and CTR for the targeted age groups. NA indicates there is no age information for those users.
Common Uses:
Using the Gemini By Age Report helps understand what age ranges are having a better CTR for your campaign. Use this information to adjust the age ranges you are targeting in Gemini Settings to optimize your campaign.
Gemini By Gender
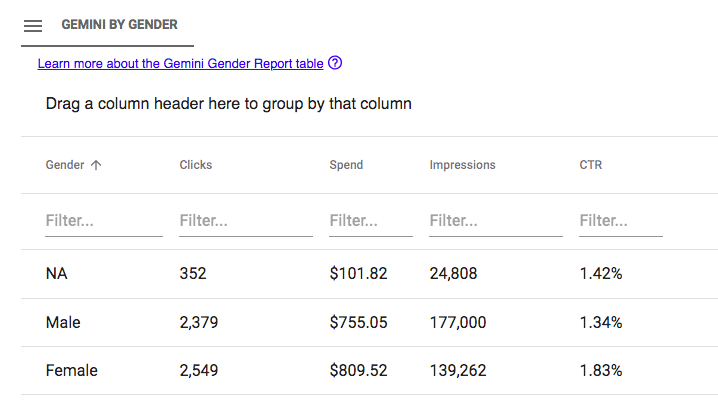
The Gemini Gender Report is only available for Gemini Campaigns. This report displays the Clicks, Spend, Impressions, and CTR for the targeted gender(s).
Common Uses:
Using the Gemini By Gender Report helps understand what gender are having a better CTR for your campaign. Use this information to adjust the genders you are targeting in Gemini Settings to optimize your campaign.
Gemini By Location
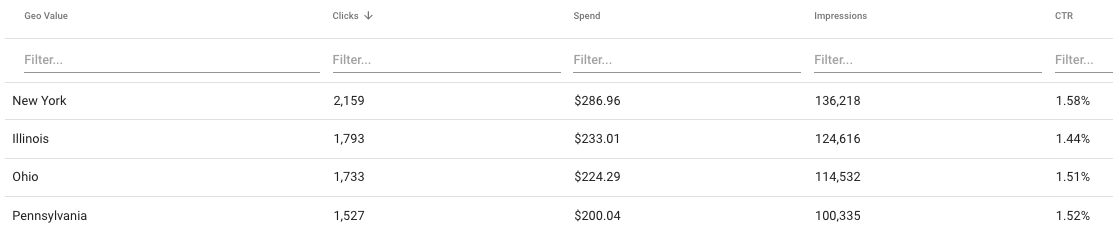
The Gemini Location Report is only available for Gemini Campaigns. This report displays the Clicks, Spend, Impressions, and CTR by Geo location for the targeting country.
Common Uses:
Using the Gemini By Location Report helps understand what locations are having a better CTR for your campaign. You can use this information to make targeting changes on the Gemini platform. For more information about targeting in Gemini click here.
Gemini Domains
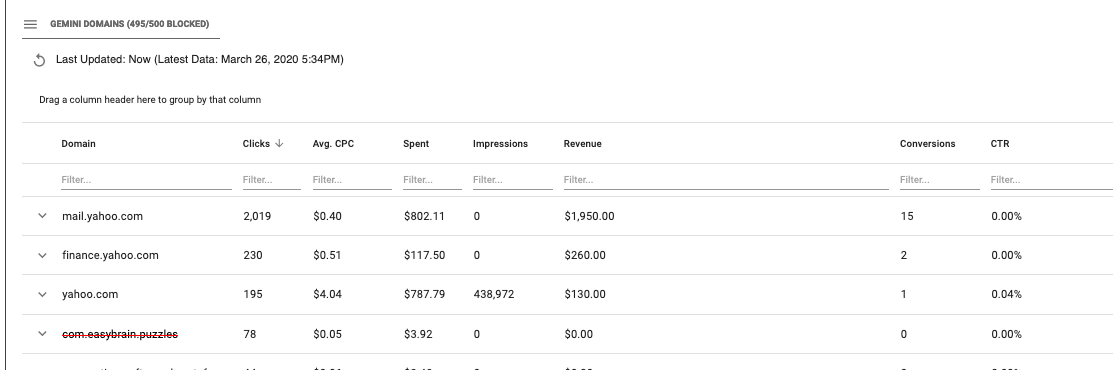
The Gemini Domains report displays the domains for Gemini traffic, as well as the clicks, Avg CPC, Spent, Impressions, Revenue, Conversions, and CTR. You can also block domains on this report by clicking on the arrow to expand the domain to reveal a block button. Clicking on this button will block a domain and it will display with a red line through it. You can unblock domains by clicking the unblock button that replaces the block button - please note that you cannot block Verizon Media owned domains.
Common Uses:
Block underperforming domains or get a better look into where Gemini sites are bidding. Click here to learn more about this report.
Campaign Log
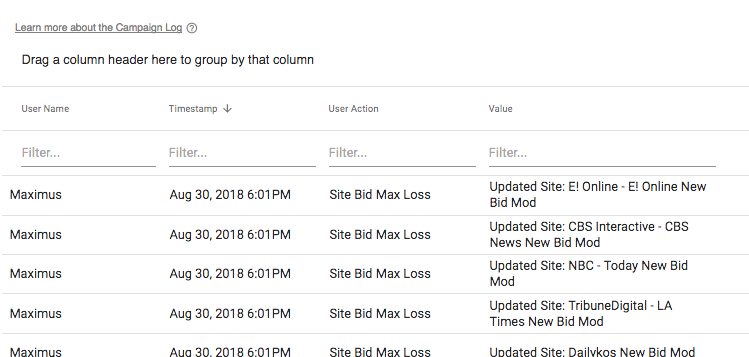
The Campaign Log shows the log of changes made to the campaign. Any user/sub user who has access to the campaign and makes a change will be recorded here. This log also keeps track of changes Maximus has done through Fire & Forget, site bid adjustments, and other processes.
Common Uses:
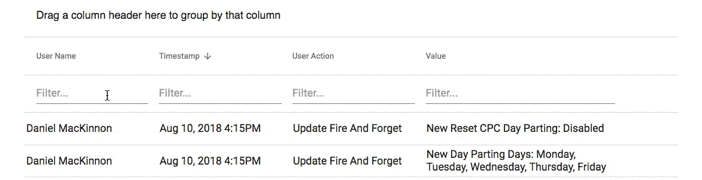
Drag to group or search for "Maximus" to find the automated changes happening to your campaign. The Campaign Log can help determine when and why changes were made to CPC, new updates Budgets, Site Bid Modifiers, and gives a look into how Maximus operates.
You can also use the campaign log to view changes made by searching or grouping the User Action column. See what Site Bid Optimizations were made, if someone did a reassignment, and more.